2024 Design & Construction Industry
Compensation Survey
Executive Summary
HELM’s Design & Construction Industry Compensation Survey provides a detailed look at the current state of compensation within the high-performance design and construction sector in the Northeast. Our goal is to help participating companies identify market trends and understand how the rapidly changing cost of living has affected wages and benefits.
This survey was distributed to HELM Construction Solutions clients and colleagues in the fall of 2024. The results were compiled and summarized by HELM to provide data to participating companies on compensation trends in the design and construction industry, with the goal of focusing attention on the People portion of the People, Planet, Prosperity triple bottom line.
Overall, wages increased an average of 11% between our 2022 survey and 2024 survey, but this varied considerably between roles with the smaller increases in entry-level roles and the largest increases in ownership and management roles. Between 2018 and 2024, on average wages increased 24%.
Survey Stats
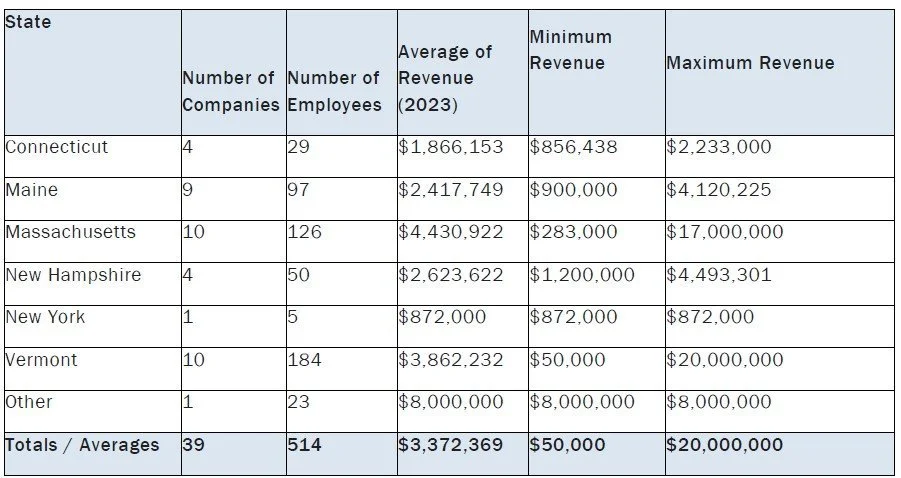
39 companies responded
Revenue ranged from $50,000/year to $20 million/year
Team size ranged from 1 to 92
A total of 514 employees are represented in the survey results
Respondents
Our respondents were primarily from the Northeast region, but we chose to report our data on each position both by state and by total company revenue. In some cases, the data set was too small to be statistically relevant, but we chose to include all the data we received.
Challenges
One of the things we wanted to look at was the benefits offered by each company. However, due to the way the information was reported, and the low number of submissions on some benefit categories, we did not feel we had statistically significant data to report averages for the dollar value of all benefit categories. Instead, you will see benefits offered ranked by the percentage of companies offering each benefit for each position, and averages where available.
Assumptions
For compensation expressed as a salary, we converted these to hourly wages based on a standard work year of 2080 hours (40 hours/week x 52 weeks). We recognize this is not necessarily true for all workers, but this gave us the best way to compare compensation.
Summary Data
Source Data by State
Source Data by Position
Next Steps
We hope to do this survey again in the future and continue to refine it to be useful to its participants. Please send any feedback on suggested changes to kath@buildhelm.com. We are curious to hear whether it is useful to you and how you choose to use it.
Survey Coordinators
Kate Stephenson, HELM Construction Solutions
Kath McCusker, HELM Construction Solutions


